5. Vector graphics editor.
5.1. Purpose
The presence of own vector graphics editor is an integral part of self-respecting SCADA system. Experience shows that the most informative form of technological process presentation is a mnemonic schemes Ч a set of alarm devices, images of the equipment, and internal connections of the controlled object, running on a PC (operator's station). To create them, you can use any of the existing graphical editors. However, thus obtained the mnemonic schemes are static and do not reflect the dynamics of changes in the characteristics of the process and, consequently, they are inadequate and uncomfortable for perception. Thus, one of the tasks facing the developers of SCADA systems is the creation of a graphical editor for creation (painting) the objects, whose characteristics can be dynamically changed.
5.2. Principles and functions of the graphic editor
The basis of the described editor are three graphic primitives: line, arc, Bézier curve. The dynamically changing the characteristics of these primitives are:
- Coordinates of control points; they are used to define the shape of the line, arc or Bézier curve. The line has two control points, the arc Ч 5 control points, Bézier curve Ч 4 (Fig. 5.2.a).
- Line width.
- Border width.
- Border color.
- Line style.
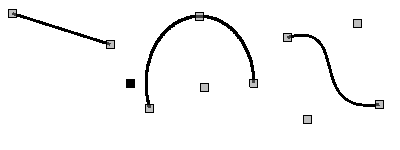
Fig. 5.2.a. Control points of the line, arcs and Bézier curve.
Examples of primitives of different colors, widths, styles with borders or without ones are shown in Fig. 5.2.b.
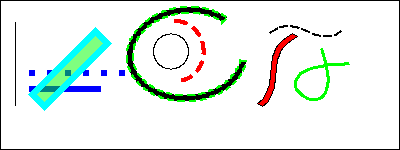
Fig. 5.2.b. Examples of primitives: line, arc and Bézier curve from left to right.
It is possible to connect the various graphic primitives for creation of complex graphic objects. If the connected primitives make the closed circuit, it can be filled with color and/or image (Fig. 5.2.c).
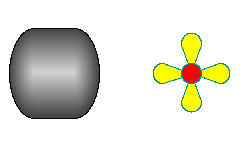
Fig. 5.2.c. Fills of the closed circuit with the colors and/or images.
Graphics editor allows you to zoom and rotate the figures (primitives and complex graphic objects) (Fig. 5.2.d).
The features of the editor also include the selection, moving, copying and deleting the figures.
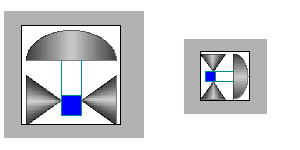
Fig. 5.2.d. Zoom and rotate the figures.
5.3. Basic principles of operation in the graphic editor
To get to work with a graphical editor after the OpenSCADA is started it is necessary to call "Operation user interface". The "Widgets" tab contains a list of existing graphic libraries and their elements.
Lets suppose that we need to add a graphic element to the one of the existing libraries. To do this, select the name of the library, and click the (![]() ) on the toolbar. In the appeared window enter the ID and name of the new graphic element. After that lets select the created item and click (
) on the toolbar. In the appeared window enter the ID and name of the new graphic element. After that lets select the created item and click (![]() ) button. The drawing area will appear on the right. By double-clicking on that field or either using the context menu lets enter the editing mode Ч the mode of the graphical editor that allows you to perform all provided manipulations with the figures. At a time when we have the created graphic element in focus, the "Attributes" tab takes the form, shown in Fig. 5.3.a.
) button. The drawing area will appear on the right. By double-clicking on that field or either using the context menu lets enter the editing mode Ч the mode of the graphical editor that allows you to perform all provided manipulations with the figures. At a time when we have the created graphic element in focus, the "Attributes" tab takes the form, shown in Fig. 5.3.a.
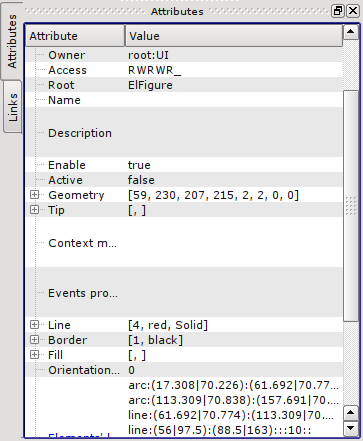
Fig. 5.3.a. Attributes of elementary figure.
With the help of mouse or the "Geometry " field of the "Attributes" tab lets define the drawing area size and scale coefficients.
Using the "Line" field of the "Attributes" tab, lets define the width, color, lines' style of the figures which we'll draw. With the "Border" field lets define the width and color of the border. The "Fill" field allows you to specify color, and image for the fills. "Elements' list" contains a list of primitives used to create the graphic object. Elements of all fields of the "Attributes" tab can be dynamically changed in the scripts (programs) of the user.
Graphics primitives can be drawn with the mouse or by specifying the list of graphical primitives ("Elements' list"). In the first case, the coordinates of control points of the primitive are computed automatically, width, color, style of the line, width and color of the border are set by defaults from the "Attributes" tab. In the second case, the primitive must be described in the "Elements' list" as follows:
arc:(x1|y1):(x2|y2):(x3|y3):(x4|y4):(x5|y5):width:color:border_width:border_color:style (2)
bezier:(x1|y1):(x2|y2):(x3|y3):(x4|y4):width:color:border_width:border_color:style, (3)
Where:
(x2|y2) Ч second control point's coordinates of the primitive;
(x3|y3) Ч third control point's coordinates of the primitive;
(x4|y4) Ч fourth control point's coordinates of the primitive;
(x5|y5) Ч fifth control point's coordinates of the primitive;
width Ч line width, with which the primitive will be drawn;
color Ч line color, with which the primitive will be drawn;
border_width Ч border width;
border_color Ч border color;
style Ч line style ("0" Ч solid, "1" Ч dashed, "2" Ч dotted).
The priority values are the width, color, style of the line, width and color of the border, specified in the "Elements' list". If you want to use any of the properties that are set in the fields "Line" or "Border" of the "Attributes" tab, then during the description of the primitive they should be skipped. For example, we want to create a line with a width of 3, red color, solid and without border. At the same time in the "Line" field the following properties are set: the line width Ч 3, black color of the line, solid line style, and in the "Border" field Ч the width of the border Ч 5, border's color Ч green. Then the description of the primitive in the "Elements' list " will be as follows:
Expressions (1) - (4) define the static properties of the primitives that can not be changed by user's program. To specify the dynamic properties it is necessary to use the following expression:
Then the "Attributes" tab will be appended by the fields: Point 1 (1), Point 2 (2), Width 1(w1), Width 2(w2), Color 1(c1), Color 2(c2), Style 1 (s1) (Fig. 5.3.b), values of these fields can be changed programmatically, by using a programming language of the OpenSCADA project. It is obvious that if desired not all properties of the primitive can be declared dynamic, but one or several, besides one dynamic property can be used repeatedly.
Editing the coordinates of control points is made either with the mouse or through changes in the "Elements' list " for static points, or directly in the "Attributes" tab, having the dynamic ones ("Point 1"...). Editing the other properties is made by means of changing the contents of the fields "Line", "Border", "Fill" of the "Attributes" tab or the "Elements' list".
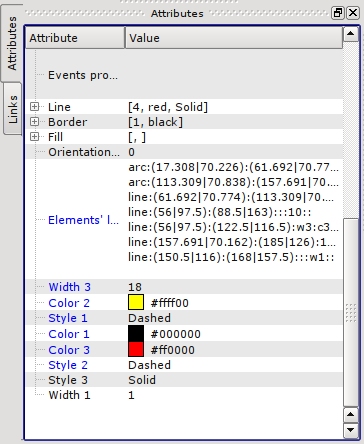
Fig. 5.3.b. Dynamic attributes of elementary figure.
There is the possibility of selection (left click on the figure) the primitive, the joint selection of primitives (left mouse button + "Ctrl" key pressed having disabled the "Connections" button), a joint selection by the frame, drawn by holding down the left mouse button; moving them (keyboard/mouse); copy and paste (ЂCtrlї + ЂCї, ЂCtrlї + ЂVї or from the popup menu); delete (ЂDelї).
To connect the primitives with each other it is necessary:
- 1) push the "Connections" button;
- 2) select one of the figures and move its start or end point to the desired start or end point of the other figure so that it will get to the appeared circle. Connected figures are moving as well as the individual ones, the general point is moved for all connected figures, to which it refers(priority is given to the arc, two arcs can't be connected directly with each other ).
- 3) release the left mouse button.
To fill the closed circuit it is necessary to make double click of the left mouse button inside it or you can specify a fill in the "Elements' list" as follows:
fill:1:2:3:...:c1:i1 Ч (dynamics).
Where:
color Ч fill color;
image Ч fill image.
The priority values are the color and image of the fill, set in the "Elements' list. " If you want to use the properties set in the "Fill" field of the "Attributes" tab, then they should be skipped in the description of the primitive.
To scale the figures it is necessary in the "Geometry" field to set the scale the for the "X" and "Y" axes. In addition, there is the ability to visually zoom in/out the widget without changing the scale in the "Geometry" field. You must exit the editing mode by the right click on the widget field, select in the popup menu "Zoom in (+10%)"/"Zoom out (-10%)", or rotate the mouse wheel while holding the "Ctrl" key pressed. Exit the editing mode is made either by pressing the "Esc", or using the popup menu of the widget.
It is possible to rotate the contents of the widget. To rotate the created objects you should set the "Orientation angle" from -360 to 360 in the "Attributes" tab.
Graphical editor supports color transparency, defined as follows: color-t, where the color Ч the color itself, and t Ч transparency from 0 (fully transparent) to 255 (opaque).
5.4. Popup menu of the graphic editor
The popup menu by the right-clicking in the editable widget is provided. Depending on what an object is under the mouse popup menu can take several different forms. Below, in Figure 5.4, there are examples of the popup menu.
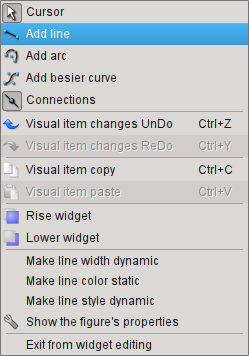
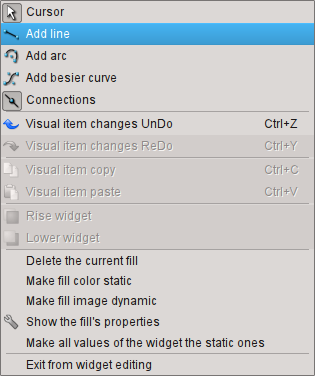
Fig. 5.4. The popup menu for the lines (line, arc, Bézier curve) and for the fill from left to right.
The popup menu includes the following sections (from top to bottom):
- drawing section, allows you to select the figure to paint, the "bindings" mode by the "Connections" item and to return to selection mode Ч "Cursor";
- undo/redo section;
- copy/paste the selected figures section;
- rising/lowering the selected figures along "Z" section;
- control section (to make static or dynamic) different properties of primitives and also for the call the properties dialog of the elementary figure;
- exit the editing mode section.
5.5. Properties dialog of the elementary figure
Dialog, versions of which are shown in Figures 5.5.a, 5.5.b, 5.5.c, is implemented for interactive and comfortable user control of the properties of the figure(s).
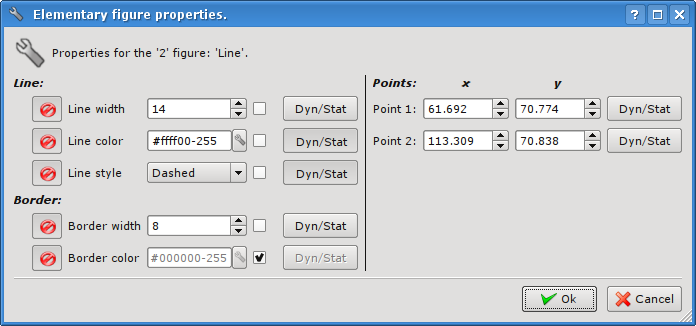
Fig. 5.5.a. Elementary figure's properties dialog for single figure (line, arc or a Bézier curve).
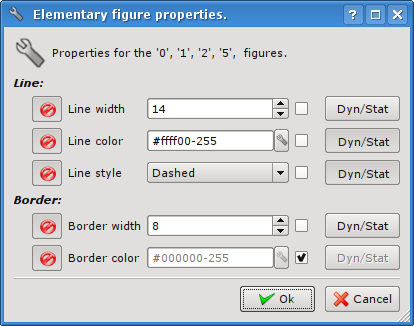
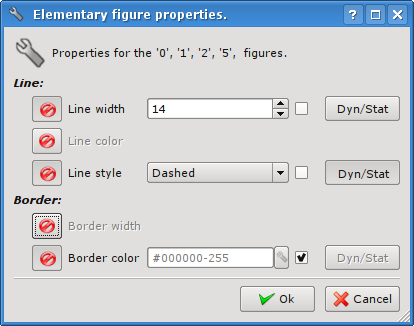
Fig. 5.5.b. Elementary figure's properties dialog for the group of selected figures.
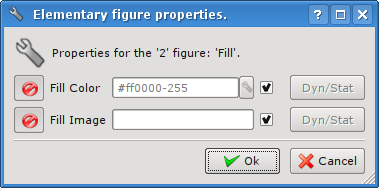
Fig. 5.5.c. Elementary figure's properties dialog for the fill.
As can be seen from the figures above, the dialog can be of three different forms, depending on the object for which it is called. In the title of the dialog there are the numbers of figures, for which it is called. These numbers correspond to the positions of figures in the "Elements' list", starting from the top.
If the dialog called for a single figure (line, arc or a Bézier curve), then it is possible to edit the points' coordinates of the figure (Fig. 5.5.a). If the point is connected to the point of another figure or figures, and "bindings" ("Connections") are enabled, then entered coordinates will be applied to all connected figures and fills, which involved the figure, will be redrawn accordingly.
If the dialog is called for the group of selected figures (Fig. 5.5.b), properties (attributes) listed in the dialog will be applied to all figures listed in the title of the dialog. When you call the dialog in the fields of the properties will be shown the data of the figure from the group of selected ones, for which it was called the popup menu. There is the possibility to include/exclude certain properties of the dialog. For this the (![]() ) button is provided. In the case of exclusion of individual properties, they will not be processed upon acceptation of the dialog ("Ok" button). After the acceptation of the dialog, all of the data of the included properties will be applied to the whole group of figures.
) button is provided. In the case of exclusion of individual properties, they will not be processed upon acceptation of the dialog ("Ok" button). After the acceptation of the dialog, all of the data of the included properties will be applied to the whole group of figures.
Dialog for the fill's properties (Fig. 5.5.c) allows you to manage the properties of the specific fill.
When selecting a check box to the right of a property, it (the property) after the acceptation of the dialog is set to the default value, which is listed in the "Attributes" tab. The "Dyn/Stat" buttons make the appropriate properties dynamic or static.